
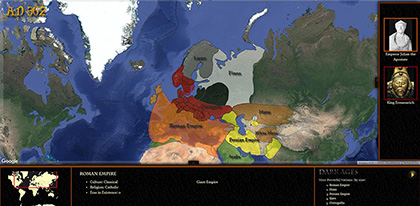
Tide of Nations
Tide of Nations is an interactive, RTS-style interface that allows users to experience the grand story of world history as it unfolds before them. Focusing primarily on the ever shifting ebb and flow of nations’ political borders, users are presented with a big picture view of history, eliminating the slew of details that can make history dry and boring to some. The Gestalt learning approach allows students to make connections between events, people, and places organically. And since learning is all about making connections, the information gleaned can be better retained.
The goal is to bring history to those who are not naturally inclined to the subject, and to promote further research for those who are. Students may not come away knowing exactly what year the Battle of Agincourt took place or the names of all of Rome’s emperors (Things they likely wouldn’t remember unless they loved history anyway), but they will likely remember that Attila the Hun invaded Europe during the Dark Ages while the Roman Empire was beginning to crumble, and that the Celtic people used to occupy most of Western Europe until Rome and the Vikings drove them out.
Like most of my projects, it is still a work in progress, but I’m always adding more, so check back often.
Project Progress
April 29
Here, at the End of All Things
Hi all! It’s been a busy week, but I’ve finished nearly everything that I need to do for my presentation next Saturday.
Based on user feedback, I’ve added a Glow on Mouse Hover feature for all interactive elements on the page. For the nations, their opacity increases on hover. Also at user request, clicking a nation label now triggers the nation details, not just clicking the nation itself. I didn’t implement every user request, but any request that did not result in a change in the code, I’ve documented as to why.
I’ve also finally squashed all of the bugs that have been hanging over this project from the beginning. (Yay!). Now I’ve got a new survey out to see how feedback improves with my new changes.
There are still just a few more things that I’d like to accomplish before Saturday, namely verifying that my Google audit scores are still in the range that I am aiming for, and implementing city detail modals. (I've dropped increasing browser compatibility from the scope: the effort to reward ratio was too high for now) Of course, presentation planning is priority, but I should have time to do more than just that.
Looking forward to Saturday!
April 22
In the Home Stretch
Hi all! It’s been a fun last stretch so far. I’ve received my first round of user testing results, and the results were predominantly positive, so no large additions to the todo list!
I’ve knocked out a couple of known bugs, and added the tutorial section. Also, since panning proved to be unachievable in the time frame of the course, I added keyboard navigation. I decided to drop the timeline navigation feature to work other more important elements of the program.
Still to do at this point are fixing the last two known bugs, making a few small changes based on the user feedback, and sending out another round of user testing. If I have time, I’ll work on browser compatibility and increasing the functionality surrounding the cities. Almost there!
April 1
Now the Fun Begins
Happy Easter all! Sorry for another skipped week. I’m running just a bit behind at this point, but not too bad. I’ve mostly completed my interface updates by adding cities and beginning to add a timeline to the map, but I’ve barely begun on the Training Indicators that were supposed to be done this week. I have reached out to my contacts for user testing and scheduled that for the weeks of the 8th and the 15th, so I’ll have time to complete the indicators before then. Once user testing begins, I’m back on schedule, though there are a currently a few more bugs than I would have hoped to go into testing with. I’ll see if I can knock a few of those out too.
March 17
Low Hanging Fruit
Dia duit and a Happy St. Patrick's Day to you all! This week I've been working on completed several small fixes and additions to the interface. A series of tasks that I'll complete next week. This week I've fixed a bug with the Go to Event function that I created last week, added the ability to mute the background music, fixed some of the persistent bugs with reverse time navigation, and added audio to some of the event types.
Other items on the docket (I'll likely not get them all finished) are Add Timeline, Show Cities, Finish Fixing Reverse Time Bugs, continue adding Audio to Events. I'll get as many as I can done in the next week, and then switch focus to creating the training indicators.
- Feb 2 - Add reverse time navigation | COMPLETE
- Feb 9 - Finalize map engine | COMPLETE
- Feb 16 - Finalize map navigation | PENDING
- Mar 9 - Finish data input | COMPLETE
- Mar 23 - Finalize interface | PENDING
- Mar 30 - Add training indicators to interface
- Apr 6 - Finalize cross-browser compatibility
- Apr 13 - complete user testing
- Apr 27 - Finalize changes arising from user testing
March 11
From Tales to Teleportation
Sorry for the delay all: life outside of school has been crazy! The past two weeks I’ve finished adding data to the application (It is soooo far from complete, but I have enough now for adequate user testing.)
I’ve also added the Go To Region function to the Events and Characters. It proved to be rather simple actually. I simply added a location column to the Event and Character tables. I did research to determine the approximate latitude and longitude most relevant to the Event or Character, and added those to the location columns. Once the data was there, I created a Go to Region button in the details modal, and set it so that the location data would be passed to that button’s location attribute. When the button is clicked, d3 grabs the location data from the attribute and sets the center of D3 map to the location coordinates. The Google map is updated in a similar manner.
February 23
Tales from the Bard
This week has been research and writing. I’ve been filling out brief summaries of the history each nation in the application, so that there is some commentary to accompany the animations. It’s a slow process, reading through the histories and condensing each one to one or two paragraphs, but Tide of Nations would have little purpose without it. Next week I’ll continue this process while fleshing out the event and character descriptions.
February 18
Project Milestones - Update
After meeting with Jen a few weeks ago, I decided to shift some of my focus regarding the tasks I plan to complete during the course of this capstone. I am minimizing the importance of cross-browser compatibility (Now focusing only on Chrome, Firefox, and Edge) and replacing the Landmark and City tasks with a block of time set aside for user testing and response. I've also decided to complete data entry before the final interface polish, in case larger sets of displayed data reveal bugs in the code. So, here is my updated Milestones Estimate.
- Feb 2 - Add reverse time navigation | COMPLETE
- Feb 9 - Finalize map engine | COMPLETE
- Feb 16 - Finalize map navigation | PENDING
- Mar 2 - Finish data input for ad362
- Mar 16 - Finish data input for ad406
- Mar 23 - Finalize interface
- Mar 30 - Add training indicators to interface
- Apr 6 - Finalize cross-browser compatibility
- Apr 13 - complete user testing
- Apr 27 - Finalize changes arising from user testing
February 16
Into the Pan, a Trial by Fire
Updating the map navigation from side-bump movement to panning has proved to be tricky. My initial thought was simply to unlock panning on the Google Map and send the new coordinates to my D3 map, but communication with the Google Map is one way: I can give it commands, but it won’t communicate with my program. Still though, I thought creating my own pan function would be rather straightforward:
- Gather coordinates of mousedown
- Gather coordinates of mouseup
- Calculate difference
- Convert to a lat/long difference
- Adjust the center of the map by that difference
But alas the problem was much deeper than I anticipated.
First the obvious issue. By only capturing mouse down and mouse up, I was not defining a continuous pan. The user would drag, nothing would happen, they would let go, then suddenly the map would snap to a new position. This would be a bad affordance and jarring experience, so I used D3’s drag function instead to capture continuous x/y coordinates. Problem solved! Not quite.
For the most part, this logic worked fine, the map did move as I panned, but there were two glaring problems. One, after beginning a drag, if I moved my mouse back the way that I came, the map still moved in the initial direction until my cursor crossed the point of mousedown. Two, the further I moved away from the point of mousedown, the faster the map moved. I could only pan in about a 50px box before the map was moving so fast it was out of the screen!
I’ve improved the issue by grabbing new coordinates every pixel, so that there is not a compounded change, but the pan is still very weird to use. Then it dawned on me, I’m trying to calculate the lat/long equivalent of a pixel coordinate delta, but that conversion will be different depending on where I click on the map (i.e. It takes a lot more pixels to fill a degree of latitude in Greenland than in Europe.) So I’m going to have to tap further into the projection algorithm to make this work…
February 9
Missing Coordinates
This week I worked on clearing out some bugs in the map display. First I dealt with an issue with the nation labels. There were times that when a nation appeared, its label would fly in from the top-left of the screen instead of growing in place as it was supposed to do. I realized that this only occurred for a few nations. After a bit of troubleshooting, I realized that the issue was not with the code, but with the data. The way the program is written, any new nations are supposed to be “primed” in the era before they actually appear. This means a tiny polygon is created as a placeholder so that the nation’s animation grows from the correct location and (apparently) so that the labels have an anchor. I added the priming polygons for the affected nations, and the issue was resolved.
The next bug was a very quick fix. I noticed that the Bavarians’ opacity increased during one of the era animations; that is never supposed to happen for any nation. It turned out that this was another data era. The Rugians layer was supposed to be replaced by the Bavarians in the given era, but I failed to remove the Rugians from the dataset, so the two layers were superimposed. I modified the Rugians’ coordinates to shrink to a pinpoint polygon as the Bavarians layer increased in size, and the problem was resolved.
Then for the real issue for the week. After adding reverse time navigation last week, I realized that in many instances nations would simply disappear as the user navigated back and forth through time. The issue only affected specific countries, but I didn’t see a single pattern as to when the errors occurred. After significant troubleshooting, I realized that part of the problem was, again, missing data. Many nations did not have the priming polygons that I mentioned earlier, but were too small to have labels, so I didn’t notice at first. However, when traveling backward in time, those priming polygons were also what caused the nations to remove themselves from the map. Without the polygons, the nations were removed from the dataset completely.
This fix still left several issues though due to a bug in the code itself. In an earlier version of the application, I had nations appearing and disappearing via opacity changes, instead of growing and shrinking. It turns out I failed to remove the code which modified opacity when a nation was removed from the map, so those nations remained invisible. Removing that code fixed the issue. Oddly enough, fixing this problem caused the Bavarians / Rugians problem to flare up again. Back to troubleshooting…
February 2
Flux Capacitors and other challenges
This week I tackled time travel. Specifically, I added the ability to navigate backward in time in Tide of Nations. In the initial version of the application, time navigation was handled by increasing a “currentEra” variable as the next era button was clicked. In addition to updating the currentEra, the button click triggered a sequence of events that pulled information relevant to the new era from the various tables on the back-end. Most of these processes required no work for reverse navigation: Simply add a new button that decreases currentEra instead increasing it and done. However, updating the map was the tricky part.
The coordinates of the map layers are stored in various JSON files, one for each era. Initially, on program load I would read in the file for the current era and preload the one for the next era. When the next era button was clicked the coordinates in the preloaded file were compared to those in the current file, and the current file was modified to match the preloaded file. Then D3’s transition function would handle the map animations of updating the screen to match the new current coordinates. While all of this was happening the new next era file would preload.
So essentially, I had one object that kept track of the current state of the map, and one that was just sitting there, waiting to be used to update the first object. It worked pretty nicely and quickly, but it only worked in one direction.
I had already written the code to keep track of a previous era object that could be used like the next era object, so I thought all I would have to do is add some test for navigation direction and reference the appropriate file. I envisioned a sequence of three objects that would copy in tandem forward or backward depending on the direction of navigation. However, I overlooked the logic that my current era file was constantly being modified. This initially caused some interesting errors where countries would swap boundaries and change colors. Pretty, avant-garde, and somewhat psychedelic; but not the effect I was going for.
I fixed this error by creating a fourth object. Now I have three JSON objects that exist for the sole purpose of acting as blueprints for the fourth, which is the one that holds the current state of the map. As forward or back is clicked, the fourth object is compared and updated to match the previous or next object, depending on what is required. Then the sequence of three blueprint objects shifts forward or backward and the exposed endcap is filled with a new preloaded object. (e.g. Moving forward in time: Present is copied to Previous, Next is copied to Present, and Next preloaded with a new JSON file.) This updated method worked beautifully, but I wasn’t quite out of the woods yet.
There a bug that caused the currentEra variable to continue increasing if the user tried to go beyond the available eras by continuing to press Forward or Backward once an end was reached. Previously I had created a quick hack that prevented the map from updating if this happened, but now that dual-direction navigation was possible it caused some errors, so I added a boundary check to the whole update process to ensure that nothing occurred if there was no data to be displayed. I just thought though, I should have the button make a different sound if it is clicked at a data endcap…
January 26
It Begins
Ah, the semester begins, the semester that will bring the completion of phase 1 of, Tide of Nations, my favorite personal project.
I first conceived of Tide of Nations back in 2014, after reading Colin McEvedy’s The New Penguin Atlas of Medieval History. I was incredibly impressed with the way that McEvedy was able to make the many simultaneous events of the history story tangible by showing their interconnectedness, and his illustrations of national boundaries gave a realness and excitement to the words on the page.
While studying McEvedy’s illustrations, my mind would frequently go back to documentaries I had seen in the past; documentaries that animated changing borders or territories. My mind would also jump to territory control games (Risk or SEGA’s Total War franchise) I had played, and everything started coming together. Why couldn’t all of history be represented with the conciseness and accuracy of McEvedy with the visual appeal of the Discovery Channel, and the engagement and immersion of Total War? Education is my passion, and this rudiment of a plan felt like a way to get students interested in a traditionally boring subject, while pulling history out of its typically siloed teaching approach.
I thought about the project periodically for about a year and a half, and finally began working on it in summer 2016. Over the course of the summer I planned the details of the project, created a foundational engine for the project and began plugging in territory data. I added enough user interaction and fluff to make it presentation worthy, but by the end of the summer I had a very pretty model that was full of holes, bugs, and incompletion. Not the best project management, but I had to give a presentation on this rudimentary application for a class, so it was not a typical development environment.
Other responsibilities put the project on hold for year, but I began working on it again after my capstone proposal was accepted. Since November, I’ve added more data to the application, began cleaning up the code a bit, and focused on finishing the Historical Figure display (the slide-out on the right) and the events dropdowns (little boxes on the left).
The Historical Figure display had two primary issues. First there was a bug where the images were not displayed properly at times, and second there was no way to handle more images than would fit in the box. I fixed the bug and set the overflow to display a scroll bar when more images exist than will fit. The latter proved to be a bit challenging. First, I had to adjust the image size so that the scroll bar would not partially cut them off. Second, this fix negated a CSS trick I was using to create the tab on the left of box. That tab technically overflows the box, so it became hidden whenever the scroll bar appeared. I had to create a new div to contain the images inside of the box that did not contain the tab. I then applied the scroll bar to that div.
The events boxes had a few enhancements needed. The application required the user to click through every box in order to close them; meaning that if they ignored the boxes and navigated to the next era, that era’s boxes would just stack on top of the previous era’s boxes, completely hidden. I added a trigger to the era advance button that cleared all events. Second, there was a bug that caused the boxes to stop advancing if one was clicked before all boxes had descended. I fixed this bug. Lastly, realizing how many event boxes there would be on completion of the entire project (every country in the world), I decided to have the boxes fall in two columns, with each column containing only certain event types. The most important categories would be in the column closer to the center of the screen. I completed the code and made the change, but quickly realized that was a very bad aesthetic choice for the limited data that the application currently contains. I commented the relevant code so that I could easily re-add it once I had more data in the system.
Next week I plan to add the ability for a user to navigate backward through time, instead of merely advancing. By the 9th, I plan to have worked out some bugs in the map engine (overlapping layers, hidden or misplaced labels, etc.). By the 16th, I will have added a new feature to the application so that it displays historically significant landmarks. The 23th should mark the completion of adding the display of historically significant cities. And finally, during the 24th through the 2nd I will work on reworking the map navigation so that users can click and drag the map rather than using the trigger points on the edge of the screen.
January 25
Capstone Rubric
This is the first draft of the rubric that I propose be used to grade my capstone.
RubricJanuary 24
Project Milestones
At this point I have completed much of the foundational work for the project, such as acquiring a domain and hosting, and creating a working application engine. The remainder of the project will involve fixing bugs and adding functionality. Below are my estimated completion dates for the remaining milestones of Tide of Nations.
- Feb 2 - Add reverse time navigation
- Feb 9 - Finalize map engine
- Feb 16 - Add support for Landmark display
- Feb 23 - Add support for City display
- Mar 2 - Finalize map navigation
- Mar 9 - Finalize interface
- Mar 23 - Add training indicators to interface
- Mar 6 - Finalize cross-browser compatibility
- Apr 13 - Finish data input for ad362
- Apr 27 - Finish data input for ad406
January 23
Capstone Proposal
I'll be using this blog to post my progress on Tide of Nations for my capstone. Here is a link to my proposal.
Proposal